Global warming
Definition

Global warming, also referred to as climate change, is the observed century-scale rise in the average temperature of the Earth's climate system and its related effects. Multiple lines of scientific evidence show that the climate system is warming. Many of the observed changes since the 1950s are unprecedented in the instrumental temperature record, which extends back to the mid-19th century, and in paleoclimate proxy records of climate change over thousands of years. The phenomenon is sometimes called "anthropogenic global warming" or "anthropogenic climate change" in view of the dominant role of human activity as its cause.
In 2013, the Intergovernmental Panel on Climate Change (IPCC) Fifth Assessment Report concluded, "It is extremely likely that human influence has been the dominant cause of the observed warming since the mid-20th century." The largest human influence has been the emission of greenhouse gases such as carbon dioxide, methane, and nitrous oxide. Climate model projections summarized in the report indicated that during the 21st century, the global surface temperature is likely to rise a further 0.3 to 1.7 °C (0.5 to 3.1 °F) in the lowest emissions scenario, and 2.6 to 4.8 °C (4.7 to 8.6 °F) in the highest emissions scenario. These findings have been recognized by the national science academies of the major industrialized nations and are not disputed by any scientific body of national or international standing.
Future climate change and associated impacts will differ from region to region. Anticipated effects include increasing global temperatures, rising sea levels, changing precipitation, and expansion of deserts in the subtropics. Warming is expected to be greater over land than over the oceans and greatest in the Arctic, with the continuing retreat of glaciers, permafrost, and sea ice. Other likely changes include more frequent extreme weather events such as heat waves, droughts, heavy rainfall with floods, and heavy snowfall; ocean acidification; and species extinctions due to shifting temperature regimes. Effects significant to humans include the threat to food security from decreasing crop yields and the abandonment of populated areas due to rising sea levels. Because the climate system has a large "inertia" and greenhouse gases will remain in the atmosphere for a long time, many of these effects will persist for not only decades or centuries, but for tens of thousands of years to come.
Possible societal responses to global warming include mitigation by emissions reduction, adaptation to its effects, building systems resilient to its effects, and possible future climate engineering. Most countries are parties to the United Nations Framework Convention on Climate Change (UNFCCC), whose ultimate objective is to prevent dangerous anthropogenic climate change. Parties to the UNFCCC have agreed that deep cuts in emissions are required and that global warming should be limited to well below 2.0 °C (3.6 °F) compared to pre-industrial levels, with efforts made to limit warming to 1.5 °C (2.7 °F).
Public reactions to global warming and concern about its effects are also increasing. A global 2015 Pew Research Center report showed that a median of 54% of all respondents asked consider it "a very serious problem". Significant regional differences exist, with Americans and Chinese (whose economies are responsible for the greatest annual CO
2 emissions) among the least concerned.
2 emissions) among the least concerned.
Observed temperature changes


Multiple independently produced datasets confirm that from 1880 to 2012 the global average (land and ocean) surface temperature increased by 0.85 [0.65 to 1.06] °C. From 1906 to 2005, Earth's average surface temperature rose by 0.74±0.18 °C. The rate of warming almost doubled in the last half of that period (0.13±0.03 °C per decade, against 0.07±0.02 °C per decade). Although the popular press often reports the increase of the average near-surface atmospheric temperature as the measure of global warming, most of the additional energy stored in the climate system since 1970 has accumulated in the oceans. The rest has melted ice and warmed the continents and the atmosphere.
Since 1979, the average temperature of the lower troposphere has increased between 0.12 and 0.135 °C (0.216 and 0.243 °F) per decade, satellite temperature measurements confirm. Climate proxies show the temperature to have been relatively stable over the one or two thousand years before 1850, with regionally varying fluctuations such as the Medieval Warm Period and the Little Ice Age.
The warming evident in the instrumental temperature record is consistent with a wide range of observations, as documented by many independent scientific groups. Examples include sea level rise, widespread melting of snow and land ice, increased heat content of the oceans, increased humidity, and the earlier timing of spring events, e.g., the flowering of plants. The probability that these changes could have occurred by chance is virtually zero.
Regional trends and short-term fluctuations

Global warming refers to global averages. It is not uniform around the world: effects can vary by region. Since 1979, global average land temperatures have increased about twice as fast as global average ocean temperatures (0.25 °C per decade against 0.13 °C per decade). Ocean temperatures increase more slowly than land temperatures because of the larger heat capacityof the oceans and because oceans lose more heat by evaporation. Since the beginning of industrialisation in the 18th century, the temperature difference between the hemispheres has increased due to melting of sea ice and snow in the North, and because there is more land in the Northern Hemisphere. In the past 100 years, average Arctic temperatures have increased at almost twice the rate of the rest of the world. This has been referred to as Arctic amplification.
Although more greenhouse gases are emitted in the Northern than in the Southern Hemisphere, this does not contribute to the difference in warming because the major greenhouse gases persist long enough to diffuse within and between the two hemispheres.
There are different ways in which a climate can be forced to change, but because the climate system has large thermal inertia, it can take centuries – or even longer – for the climate to fully adjust. One climate commitment study concluded that if greenhouse gases were stabilized at year 2000 levels, surface temperatures would still increase by about 0.5 °C, and another found that if they were stabilized at 2005 levels, surface warming could exceed a whole degree Celsius. Some of this surface warming would be driven by past natural forcings which have not yet reached equilibrium in the climate system. One study using a highly simplified climate model indicates these past natural forcings may account for as much as 64% of the committed 2050 surface warming, and their influence will fade with time compared to the human contribution.
Global temperature is subject to short-term fluctuations that overlay long-term trends, and can temporarily mask or magnify them. The relative stability in surface temperature from 2002 to 2009, which has since been dubbed the global warming hiatus by the media and some scientists, may be an example of such an episode. 2015 updates to account for differing methods of ocean surface temperature measurements show a positive trend over the recent decade.
Warmest years vs. overall trend
Sixteen of the seventeen warmest years on record have occurred since 2000. While record-breaking years attract considerable public interest, individual years are less significant than the overall trend. Some climatologists have criticized the attention that the popular press gives to "warmest year" statistics. In particular, ocean oscillations such as the El Niño Southern Oscillation (ENSO) can cause temperatures of a given year to be abnormally warm or cold for reasons unrelated to the overall trend of climate change. Gavin Schmidt stated: "the long-term trends or the expected sequence of records are far more important than whether any single year is a record or not."
Initial causes of temperature changes (external forcings)
By itself, the climate system may generate random changes in global temperatures for years to decades at a time, but long-term changes emanate only from so-called external forcings. These forcings are "external" to the climate system, but not necessarily external to Earth. Examples of external forcings include changes in the composition of the atmosphere (e.g., increased concentrations of greenhouse gases), solar luminosity, volcanic eruptions, and variations in Earth's orbit around the Sun.
Greenhouse gases
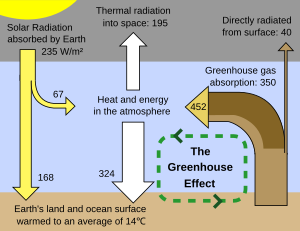
The greenhouse effect is the process by which absorption and emission of infrared radiation by gases in a planet's atmosphere warm its lower atmosphere and surface. It was proposed by Joseph Fourier in 1824, discovered in 1860 by John Tyndall, was first investigated quantitatively by Svante Arrhenius in 1896, and its scientific description was developed in the 1930s through 1960s by Guy Stewart Callendar.


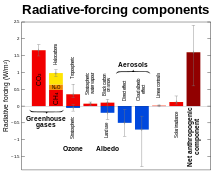
On Earth, an atmosphere containing naturally occurring amounts of greenhouse gases causes air temperature near the surface to be warmer by about 33 °C (59 °F) than it would be in their absence. Without the Earth's atmosphere, the Earth's average temperature would be well below the freezing temperature of water. The major greenhouse gases are water vapour, which causes about 36–70% of the greenhouse effect; carbon dioxide (CO2), which causes 9–26%; methane (CH4), which causes 4–9%; and ozone (O3), which causes 3–7%. Clouds also affect the radiation balance through cloud forcings similar to greenhouse gases.
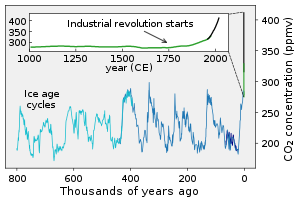
Human activity since the Industrial Revolution has increased the amount of greenhouse gases in the atmosphere, leading to increased radiative forcing from CO2, methane, tropospheric ozone, CFCs, and nitrous oxide. According to work published in 2007, the concentrations of CO2 and methane had increased by 36% and 148% respectively since 1750. These levels are much higher than at any time during the last 800,000 years, the period for which reliable data has been extracted from ice cores. Less direct geological evidence indicates that CO2 values higher than this were last seen about 20 million years ago.
Fossil fuel burning has produced about three-quarters of the increase in CO2 from human activity over the past 20 years. The rest of this increase is caused mostly by changes in land-use, particularly deforestation. Another significant non-fuel source of anthropogenic CO2 emissions is the calcination of limestone for clinker production, a chemical process which releases CO2. Estimates of global CO2 emissions in 2011 from fossil fuel combustion, including cement production and gas flaring, was 34.8 billion tonnes (9.5 ± 0.5 PgC), an increase of 54% above emissions in 1990. Coal burning was responsible for 43% of the total emissions, oil 34%, gas 18%, cement 4.9% and gas flaring 0.7%.
In May 2013, it was reported that readings for CO2 taken at the world's primary benchmark site in Mauna Loa surpassed 400 ppm. According to professor Brian Hoskins, this is likely the first time CO2 levels have been this high for about 4.5 million years. Monthly global CO2 concentrations exceeded 400 ppm in March 2015, probably for the first time in several million years. On 12 November 2015, NASA scientists reported that human-made carbon dioxide continues to increase above levels not seen in hundreds of thousands of years; currently, about half of the carbon dioxide released from the burning of fossil fuels is not absorbed by vegetation and the oceans and remains in the atmosphere.
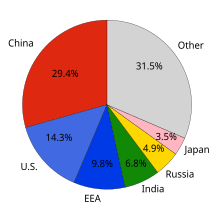
Over the last three decades of the twentieth century, gross domestic product per capita and population growth were the main drivers of increases in greenhouse gas emissions. CO2 emissions are continuing to rise due to the burning of fossil fuels and land-use change. Emissions can be attributed to different regions. Attributions of emissions due to land-use change are subject to considerable uncertainty.
Emissions scenarios, estimates of changes in future emission levels of greenhouse gases, have been projected that depend upon uncertain economic, sociological, technological, and natural developments. In most scenarios, emissions continue to rise over the century, while in a few, emissions are reduced. Fossil fuel reserves are abundant, and will not limit carbon emissions in the 21st century. Emission scenarios, combined with modelling of the carbon cycle, have been used to produce estimates of how atmospheric concentrations of greenhouse gases might change in the future. Using the six IPCC SRES "marker" scenarios, models suggest that by the year 2100, the atmospheric concentration of CO2 could range between 541 and 970 ppm. This is 90–250% above the concentration in the year 1750.
Aerosols and soot

Global dimming, a gradual reduction in the amount of global direct irradiance at the Earth's surface, was observed from 1961 until at least 1990. Solid and liquid particles known as aerosols, produced by volcanoes and human-made pollutants, are thought to be the main cause of this dimming. They exert a cooling effect by increasing the reflection of incoming sunlight. The effects of the products of fossil fuel combustion – CO2 and aerosols – have partially offset one another in recent decades, so that net warming has been due to the increase in non-CO2 greenhouse gases such as methane. Radiative forcing due to aerosols is temporally limited due to the processes that remove aerosols from the atmosphere. Removal by clouds and precipitation gives tropospheric aerosols an atmospheric lifetime of only about a week, while stratospheric aerosols can remain for a few years. Carbon dioxide has a lifetime of a century or more, and as such, changes in aerosols will only delay climate changes due to carbon dioxide. Black carbon is second only to carbon dioxide for its contribution to global warming (contribution being estimated at 17 to 20%, whereas carbon dioxide contributes 40 to 45% to global warming).
In addition to their direct effect by scattering and absorbing solar radiation, aerosols have indirect effects on the Earth's radiation budget. Sulfate aerosols act as cloud condensation nuclei and thus lead to clouds that have more and smaller cloud droplets. These clouds reflect solar radiation more efficiently than clouds with fewer and larger droplets, a phenomenon known as the Twomey effect. This effect also causes droplets to be of more uniform size, which reduces growth of raindrops and makes the cloud more reflective to incoming sunlight, known as the Albrecht effect. Indirect effects are most noticeable in marine stratiform clouds, and have very little radiative effect on convective clouds. Indirect effects of aerosols represent the largest uncertainty in radiative forcing.
Soot may either cool or warm Earth's climate system, depending on whether it is airborne or deposited. Atmospheric soot directly absorbs solar radiation, which heats the atmosphere and cools the surface. In isolated areas with high soot production, such as rural India, as much as 50% of surface warming due to greenhouse gases may be masked by atmospheric brown clouds. When deposited, especially on glaciers or on ice in arctic regions, the lower surface albedo can also directly heat the surface. The influences of atmospheric particles, including black carbon, are most pronounced in the tropics and sub-tropics, particularly in Asia, while the effects of greenhouse gases are dominant in the extratropics and southern hemisphere.
Solar activity
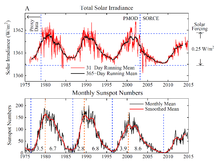
Since 1978, solar irradiance has been measured by satellites. These measurements indicate that the Sun's radiative output has not increased since then, so the warming that occurred in the past 40 years cannot be attributed to an increase in solar energy reaching the Earth.
Climate models have been used to examine the role of the Sun in recent climate change. Models are unable to reproduce the rapid warming observed in recent decades when only taking into account variations in solar output and volcanic activity. Models are, however, able to simulate the observed 20th century changes in temperature when they include all of the most important external forcings, consisting of both human influences and natural forcings.
Another line of evidence for the Sun's non-attributability is the differing temperature changes at different levels in the Earth's atmosphere.According to basic physical principles, the greenhouse effect produces warming of the lower atmosphere (the troposphere), but cooling of the upper atmosphere (the stratosphere). If solar variations were responsible for the observed warming, warming of both the troposphere and the stratosphere would be expected.
Variations in Earth's orbit
The tilt of the Earth’s axis and the shape of its orbit around the Sun vary slowly over tens of thousands of years. This changes climate by changing the seasonal and latitudinal distribution of incoming solar energy at Earth's surface. During the last few thousand years, this phenomenon contributed to a slow cooling trend at high latitudes of the Northern Hemisphere during summer, a trend that was reversed by greenhouse-gas-induced warming during the 20th century. Orbital cycles favorable for glaciation are not expected within the next 50,000 years.
Climate change feedback
The climate system includes a range of feedbacks, which alter the response of the system to changes in external forcings. Positive feedbacks increase the response of the climate system to an initial forcing, while negative feedbacks reduce it. Climate system feedbacks feature thresholds, constrained by planetary boundary conditions, which may trigger other processes on regional or global scale, and may act in a non-linear expression, until a system reaches a new stable state.
There are a range of feedbacks in the climate system, including water vapour, changes in ice-albedo (snow and ice cover affect how much the Earth's surface absorbs or reflects incoming sunlight), clouds, and changes in the Earth's carbon cycle (e.g., the release of carbon from soil). The main negative feedback is the energy the Earth's surface radiates into space as infrared radiation. According to the Stefan-Boltzmann law, if the absolute temperature (as measured in kelvins) doubles, radiated energy increases by a factor of 16 (2 to the 4th power).
Feedbacks are an important factor in determining the sensitivity of the climate system to increased atmospheric greenhouse gas concentrations. Other factors being equal, a higher climate sensitivity means that more warming will occur for a given increase in greenhouse gas forcing. Uncertainty over the effect of feedbacks is a major reason why different climate models project different magnitudes of warming for a given forcing scenario. More research is needed to understand the role of clouds and carbon cycle feedbacks in climate projections.
The IPCC projections previously mentioned span the "likely" range (greater than 66% probability, based on expert judgement) for the selected emissions scenarios. However, the IPCC's projections do not reflect the full range of uncertainty. The lower end of the "likely" range appears to be better constrained than the upper end.
An observation based study on future climate change, on the soil carbon feedback, conducted since 1991 in Harvard, suggests release of about 190 petagrams of soil carbon, the equivalent of the past two decades of greenhouse gas emissions from fossil fuel burning, until 2100 from the top 1-meter of Earth's soils, due to changes in microbial communities under elevated temperatures. Climate models do not account for this possible feedback mechanism. Another study conducted by Harvard researchers suggests that increased water vapor injected into the stratosphere, due to rising temperatures, increases ozone depletion, subsequently raising the odds of skin cancer and damaging crops.
A 2018 study tried to identify a planetary threshold for self-reinforcing feedbacks that progress even when man-made emissions are reduced, which could eventually lead to a new hothouse climate state. This would make parts of the world uninhabitable, raise sea levels by up to 60 metres (200 ft), and raise temperatures by 4–5 °C (7.2–9.0 °F) to levels that are higher than any interglacial period in the past 1.2 million years. The authors suggest, based on previous studies, that even a 2 °C (3.6 °F) increase in temperature over pre-industrial levels, which is the upper limit set in the Paris Agreement, may be enough to trigger such a hothouse Earth scenario. Co-author Johan Rockström notes that whether this would occur "is one of the most existential questions in science." Study author Katherine Richardson stresses, "We note that the Earth has never in its history had a quasi-stable state that is around 2 °C warmer than the preindustrial and suggest that there is substantial risk that the system, itself, will ‘want’ to continue warming because of all of these other processes – even if we stop emissions. This implies not only reducing emissions but much more.”
Arctic amplification
The 2007 IPCC report noted that Arctic temperatures have increased at almost twice the rate of the rest of the world. This has been referred to as Arctic amplification. The observed Arctic amplification appears to arise both from a intensification of poleward heat transport and more directly from changes in the local net radiation balance. Some examples of climate system feedbacks thought to contribute to recent polar amplification include the reduction of snow cover and sea ice, changes in atmospheric and ocean circulation, the presence of anthropogenic soot in the Arctic environment, increases in cloud cover, and water vapor. According to the 2013 IPCC report, models often tend to underestimate Arctic amplification.
Studies have linked the rapidly warming Arctic to a vanishing cryosphere, and extreme weather in mid-latitudes. Studies further link Arctic amplification to extreme weather, caused by changes in the jet stream. Extreme prolonged weather events tied to almost stationary jet stream waves in the Northern Hemisphere include the 2003 European heat wave, the 2010 Russian heat wave, the 2010 Pakistan floods, or the 2018 European heat wave.
Climate models


A climate model is a representation of the physical, chemical and biological processes that affect the climate system. Such models are based on scientific disciplines such as fluid dynamics and thermodynamics as well as physical processes such as radiative transfer. The models may be used to predict a range of variables such as local air movement, temperature, clouds, and other atmospheric properties; ocean temperature, salt content, and circulation; ice cover on land and sea; the transfer of heat and moisture from soil and vegetation to the atmosphere; and chemical and biological processes, among others.
Although researchers attempt to include as many processes as possible, simplifications of the actual climate system are inevitable because of the constraints of available computer power and limitations in knowledge of the climate system. Results from models can also vary due to different greenhouse gas inputs and the model's climate sensitivity. For example, the uncertainty in IPCC's 2007 projections is caused by (1) the use of multiple models with differing sensitivity to greenhouse gas concentrations, (2) the use of differing estimates of humanity's future greenhouse gas emissions, (3) any additional emissions from climate feedbacks that were not included in the models IPCC used to prepare its report, i.e., greenhouse gas releases from permafrost.
The models do not assume the climate will warm due to increasing levels of greenhouse gases. Instead the models predict how greenhouse gases will interact with radiative transfer and other physical processes. Warming or cooling is thus a result, not an assumption, of the models.
Clouds and their effects are especially difficult to predict. Improving the models' representation of clouds is therefore an important topic in current research. Another prominent research topic is expanding and improving representations of the carbon cycle.
Models are also used to help investigate the causes of recent climate change by comparing the observed changes to those that the models project from various natural and human causes. Although these models do not unambiguously attribute the warming that occurred from approximately 1910 to 1945 to either natural variation or human effects, they do indicate that the warming since 1970 is dominated by anthropogenic greenhouse gas emissions.
The physical realism of models is tested by examining their ability to simulate contemporary or past climates. Climate models produce a good match to observations of global temperature changes over the last century, but do not simulate all aspects of climate.Not all effects of global warming are accurately predicted by the climate models used by the IPCC. Observed Arctic shrinkage has been faster than that predicted. Precipitation increased proportionally to atmospheric humidity, and hence significantly faster than global climate models predict. Since 1990, sea level has also risen considerably faster than models predicted it would.
Effects


Biosphere
Overall, it is expected that climate change will result in the extinction of many species and reduced diversity of ecosystems.Rising temperatures have been found to push bees to their physiological limits, and could cause the extinction of bee populations. A 2012 study concluded that continued ocean uptake of CO2 affects the brains and central nervous system of certain fish species and this impacts their ability to hear, smell, and evade predators. The study authors note, "We've now established it isn't simply the acidification of the oceans that is causing disruption -- as is the case with shellfish and plankton with chalky skeletons -- but the actual dissolved CO2 itself is damaging the fishes' nervous systems."
Environmental
The environmental effects of global warming are broad and far reaching. They include the following diverse effects:
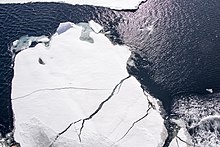
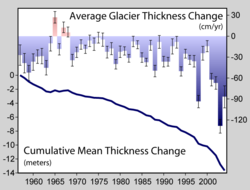
- Arctic sea ice decline, sea level rise, retreat of glaciers: Global warming has led to decades of shrinking and thinning in a warm climate that has put the Arctic sea ice in a precarious position, it is now vulnerable to atmospheric anomalies.Projections of declines in Arctic sea ice vary. Recent projections suggest that Arctic summers could be ice-free (defined as ice extent less than 1 million square km) as early as 2025–2030. The sea level rise since 1993 has been estimated to have been on average 2.6 mm and 2.9 mm per year ± 0.4 mm. Additionally, sea level rise has accelerated from 1995 to 2015. Over the 21st century, the IPCC projects for a high emissions scenario, that global mean sea level could rise by 52–98 cm.
- Extreme weather, extreme events, tropical cyclones: Data analysis of extreme events from 1960 until 2010 suggests that droughts and heat waves appear simultaneously with increased frequency. Extremely wet or dry events within the monsoon period have increased since 1980. Projections suggest a probable increase in the frequency and severity of some extreme weather events, such as heat waves.
- Ecosystem changes, changes in ocean properties: In terrestrial ecosystems, the earlier timing of spring events, as well as poleward and upward shifts in plant and animal ranges, have been linked with high confidence to recent warming. It is expected that most ecosystems will be affected by higher atmospheric CO2 levels, combined with higher global temperatures. Expansion of deserts in the subtropics is probably linked to global warming . The physical effect of global warming on oceans include an increase in acidity, and a reduction of oxygen levels (ocean deoxygenation). Increases in atmospheric CO2 concentrations have led to an increase in dissolved CO2 and thus ocean acidity, measured by lower pH values. Ocean acidification threatens damage to coral reefs, fisheries, protected species, and other natural resources of value to society.
- Long-term effects of global warming, runaway climate change: On the timescale of centuries to millennia, the magnitude of global warming will be determined primarily by anthropogenic CO2 emissions. This is due to carbon dioxide's very long lifetime in the atmosphere.Long-term effects also include a response from the Earth's crust, due to ice melting and deglaciation, in a process called post-glacial rebound, when land masses are no longer depressed by the weight of ice. This could lead to landslides and increased seismic and volcanic activities. Tsunamis could be generated by submarine landslides caused by warmer ocean water thawing ocean-floor permafrost or releasing gas hydrates.
- Abrupt climate change, cold blob (North Atlantic): Climate change could result in global, large-scale changes in natural and social systems. Examples include ocean acidification caused by increased atmospheric concentrations of carbon dioxide, and the long-term melting of ice sheets, which contributes to sea level rise. Some large-scale changes could occur abruptly, i.e., over a short time period, and might also be irreversible. Examples of abrupt climate change are the rapid release of methane and carbon dioxide from permafrost, which would lead to amplified global warming. Another example is the possibility for the Atlantic Meridional Overturning Circulation to slow- or shutdown (see also shutdown of thermohaline circulation). This could trigger cooling in the North Atlantic, Europe, and North America. It would particularly affect areas such as the British Isles, France and the Nordic countries, which are warmed by the North Atlantic drift.
Social systems
The effects of climate change on human systems, mostly due to warming or shifts in precipitation patterns, or both, have been detected worldwide. The future social impacts of climate change will be uneven across the world. Many risks are expected to increase with higher magnitudes of global warming. All regions are at risk of experiencing negative impacts. Low-latitude, less developed areas face the greatest risk. A study from 2015 concluded that economic growth (gross domestic product) of poorer countries is much more impaired with projected future climate warming, than previously thought. In small islands and mega deltas, inundation as a result of sea level rise is expected to threaten vital infrastructure and human settlements. This could lead to issues of homelessness in countries with low-lying areas such as Bangladesh, as well as statelessness for populations in countries such as the Maldives and Tuvalu.
Examples of impacts of global warming on humans include:
- A meta-analysis concluded in 2014 that each degree of temperature rise will increase violence by up to 20%, which includes fist fights, violent crimes, civil unrest, or wars.
- Estimates in 2015 based on the IPCC A1B emission scenario from additional greenhouse gases released from permafrost, found associated impact damages to the economy to be US$43 trillion.
- Crop production will probably be negatively affected in low latitude countries, while effects at northern latitudes may be positive or negative. Global warming of around 4.6 °C relative to pre-industrial levels could pose a large risk to global and regional food security. The impact of climate change on crop productivity for the four major crops was negative for wheat and maize and neutral for soy and rice in the years 1960-2013. While crop production has increased in some mid-latitude regions such as the UK and Northeast China, economic losses due to extreme weather events have increased globally. See also Climate change and agriculture.
- Generally impacts on public health will be more negative than positive. Impacts include: the effects of extreme weather, leading to injury and loss of life; and indirect effects, such as undernutrition brought on by crop failures. There has been a shift from cold- to heat-related mortality in some regions as a result of warming. A 2018 study of data from the U.S. Centers for Disease Control and Prevention connected temperature rise to increased numbers of suicides. The study revealed that hotter days could increase suicide rates and could cause approximately 26,000 more suicides in the U.S. by 2050.
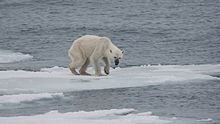
- Livelihoods of indigenous peoples of the Arctic have been altered by climate change, and there is emerging evidence of climate change impacts on livelihoods of indigenous peoples in other regions. Regional impacts of climate change are now observable at more locations than before, on all continents and across ocean regions.
Regional
The Arctic, Africa, small islands and Asian megadeltas are regions that are likely to be especially affected by future climate change. Africa is one of the most vulnerable continents to climate variability and change because of multiple existing stresses and low adaptive capacity. Existing stresses include poverty, political conflicts, and ecosystem degradation. By 2050, between 350 million and 600 million people are projected to experience increased water stress due to climate change (see Climate change in Africa). Climate variability and change is projected to severely compromise agricultural production, including access to food, across Africa. Research projects that regions even may become uninhabitable, due to the so called wet-bulb temperature.
Responses
Mitigation

Mitigation of climate change are actions to reduce greenhouse gas emissions, or enhance the capacity of carbon sinks to absorb greenhouse gases from the atmosphere. There is a large potential for future reductions in emissions by a combination of activities, including energy conservation and increased energy efficiency; the use of low-carbon energy technologies, such as renewable energy, nuclear energy, and carbon capture and storage; and enhancing carbon sinks through, for example, reforestation and preventing deforestation. A 2015 report by Citibank concluded that transitioning to a low carbon economy would yield positive return on investments.
Near- and long-term trends in the global energy system are inconsistent with limiting global warming at below 1.5 or 2 °C, relative to pre-industrial levels. Pledges made as part of the Cancún agreements are broadly consistent with having a likely chance (66 to 100% probability) of limiting global warming (in the 21st century) at below 3 °C, relative to pre-industrial levels.
In limiting warming at below 2 °C, more stringent emission reductions in the near-term would allow for less rapid reductions after 2030. Many integrated models are unable to meet the 2 °C target if pessimistic assumptions are made about the availability of mitigation technologies.
Adaptation
Climate change adaptation is another policy response. The adaptation may be planned, either in reaction to or anticipation of global warming, or spontaneous, i.e., without government intervention. Planned adaptation is already occurring on a limited basis. The barriers, limits, and costs of future adaptation are not fully understood. Environmental organizations and public figures have emphasized changes in the climate and the risks they entail, while promoting adaptation to changes in infrastructural needs and emissions reductions.
Adaptation is especially important in developing countries since those countries are predicted to bear the brunt of the effects of global warming. That is, the capacity and potential for humans to adapt (called adaptive capacity) is unevenly distributed across different regions and populations, and developing countries generally have less capacity to adapt.
Climate engineering
Climate engineering (sometimes called geoengineering or climate intervention) is the deliberate modification of the climate. It has been investigated as a possible response to global warming, e.g. by NASA and the Royal Society. Techniques under research fall generally into the categories solar radiation management and carbon dioxide removal, although various other schemes have been suggested. A study from 2014 investigated the most common climate engineering methods and concluded they are either ineffective or have potentially severe side effects and cannot be stopped without causing rapid climate change.
Society and culture
Political discussion

Most countries in the world are parties to the United Nations Framework Convention on Climate Change (UNFCCC). The ultimate objective of the Convention is to prevent dangerous human interference of the climate system. As stated in the Convention, this requires that greenhouse gas concentrations are stabilized in the atmosphere at a level where ecosystems can adapt naturally to climate change, food production is not threatened, and economic development can proceed in a sustainable fashion. The Framework Convention was agreed on in 1992, but global emissions have risen since then.
During negotiations, the G77 (a lobbying group in the United Nations representing 133 developing countries) pushed for a mandate requiring developed countries to "[take] the lead" in reducing their emissions. This was justified on the basis that the developed countries' emissions had contributed most to the cumulation of greenhouse gases in the atmosphere, per-capita emissions (i.e., emissions per head of population) were still relatively low in developing countries, and the emissions of developing countries would grow to meet their development needs.
This mandate was sustained in the Kyoto Protocol to the Framework Convention, which entered into legal effect in 2005. In ratifying the Kyoto Protocol, most developed countries accepted legally binding commitments to limit their emissions. These first-round commitments expired in 2012. United States President George W. Bush rejected the treaty on the basis that "it exempts 80% of the world, including major population centres such as China and India, from compliance, and would cause serious harm to the US economy."
At the 15th UNFCCC Conference of the Parties, held in 2009 at Copenhagen, several UNFCCC Parties produced the Copenhagen Accord.Parties associated with the Accord (140 countries, as of November 2010) aim to limit the future increase in global mean temperature to below 2 °C. The 16th Conference of the Parties (COP16) was held at Cancún in 2010. It produced an agreement, not a binding treaty, that the Parties should take urgent action to reduce greenhouse gas emissions to meet a goal of limiting global warming to 2 °C above pre-industrial temperatures. It also recognized the need to consider strengthening the goal to a global average rise of 1.5 °C.
Scientific discussion
The discussion continues in scientific articles that are peer-reviewed and assessed by scientists who work in the relevant fields and participate in the Intergovernmental Panel on Climate Change. The scientific consensus as of 2013 stated in the IPCC Fifth Assessment Report is that it "is extremely likely that human influence has been the dominant cause of the observed warming since the mid-20th century". A 2008 report by the U.S. National Academy of Sciences stated that most scientists by then agreed that observed warming in recent decades was primarily caused by human activities increasing the amount of greenhouse gases in the atmosphere. In 2005 the Royal Society stated that while the overwhelming majority of scientists were in agreement on the main points, some individuals and organizations opposed to the consensus on urgent action needed to reduce greenhouse gas emissions had tried to undermine the science and work of the IPCC. National science academies have called on world leaders for policies to cut global emissions.
In the scientific literature, there is a strong consensus that global surface temperatures have increased in recent decades and that the trend is caused mainly by human-induced emissions of greenhouse gases. No scientific body of national or international standing disagrees with this view. In November 2017, a second warning to humanity signed by 15,364 scientists from 184 countries stated that "the current trajectory of potentially catastrophic climate change due to rising greenhouse gases from burning fossil fuels, deforestation, and agricultural production – particularly from farming ruminants for meat consumption" is "especially troubling". A July 2017 study published in Environmental Research Letters asserts that the most significant action individuals could make to mitigate their own carbon footprint is to have fewer children, followed by living vehicle free, forgoing air travel and adopting a plant-based diet.
Public opinion and disputes

The global warming controversy refers to a variety of disputes, substantially more pronounced in the popular media than in the scientific literature,regarding the nature, causes, and consequences of global warming. The disputed issues include the causes of increased global average air temperature, especially since the mid-20th century, whether this warming trend is unprecedented or within normal climatic variations, whether humankind has contributed significantly to it, and whether the increase is completely or partially an artefact of poor measurements. Additional disputes concern estimates of climate sensitivity, predictions of additional warming, and what the consequences of global warming will be.
In the United States from about 1990 onwards, American conservative think tanks had begun challenging the legitimacy of global warming as a social problem. They challenged the scientific evidence, argued that global warming would have benefits, and asserted that proposed solutions would do more harm than good. Some people dispute aspects of climate change science. Organizations such as the libertarian Competitive Enterprise Institute, conservative commentators, and some companies such as ExxonMobil have challenged IPCC climate change scenarios, funded scientists who disagree with the scientific consensus, and provided their own projections of the economic cost of stricter controls. On the other hand, some fossil fuel companies have scaled back their efforts in recent years, or even called for policies to reduce global warming. Global oil companies have begun to acknowledge climate change exists and is caused by human activities and the burning of fossil fuels.
The global warming problem came to international public attention in the late 1980s. Polling groups began to track opinions on the subject, at first mainly in the United States. The longest consistent polling, by Gallup in the US, found relatively small deviations of 10% or so from 1998 to 2015 in opinion on the seriousness of global warming, but with increasing polarization between those concerned and those unconcerned.
Due to confusing media coverage in the early 1990s, issues such as ozone depletion and climate change were often mixed up, affecting public understanding of these issues. According to a 2010 survey of Americans, a majority thought that the ozone layer and spray cans contribute to global warming. Although there are a few areas of linkage, the relationship between the two is not strong. Reduced stratospheric ozone has had a slight cooling influence on surface temperatures, while increased tropospheric ozone has had a somewhat larger warming effect.However, the CFC's used in spray cans are powerful greenhouse gases, with some estimates attributing CFC emissions during the 70s to have caused almost half of the global warming for that decade.
By 2010, with 111 countries surveyed, Gallup determined that there had been a substantial decrease since 2007–2008 in the number of Americans and Europeans who viewed global warming as a serious threat. In the US, just a little over half the population (53%) viewed it as a serious concern for either themselves or their families; this was 10 points below the 2008 poll (63%). Latin America had the biggest rise in concern: 73% said global warming was a serious threat to their families. This global poll also found that people were more likely to attribute global warming to human activities than to natural causes, except in the US where nearly half (47%) of the population attributed global warming to natural causes.
A March–May 2013 survey by Pew Research Center for the People & the Press polled 39 countries about global threats. According to 54% of those questioned, global warming featured top of the perceived global threats.
History
The history of climate change science began in the early 19th century when ice ages and other natural changes in paleoclimate were first suspected and the natural greenhouse effect first identified. In the late 19th century, scientists first argued that human emissions of greenhouse gases could change the climate. In the 1960s, the warming effect of carbon dioxide gas became increasingly convincing. By the 1990s, as a result of improving fidelity of computer models and observational work confirming the Milankovitch theory of the ice ages, a consensus position formed: greenhouse gases were deeply involved in most climate changes and human caused emissions were bringing discernible global warming. Since the 1990s, scientific research on climate change has included multiple disciplines and has expanded. Research during this period has been summarized in the Assessment Reports by the Intergovernmental Panel on Climate Change.
Terminology
In the 1950s, research suggested increasing temperatures, and a 1952 newspaper reported "climate change". This phrase next appeared in a November 1957 report in The Hammond Timeswhich described Roger Revelle's research into the effects of increasing human-caused CO2 emissions on the greenhouse effect, "a large scale global warming, with radical climate changes may result". Both phrases were only used occasionally until 1975, when Wallace Smith Broecker published a scientific paper on the topic, "Climatic Change: Are We on the Brink of a Pronounced Global Warming?" The phrase began to come into common use, and in 1976 Mikhail Budyko's statement that "a global warming up has started" was widely reported. Other studies, such as a 1971 MIT report, referred to the human impact as "inadvertent climate modification", but an influential 1979 National Academy of Sciences study headed by Jule Charneyfollowed Broecker in using global warming for rising surface temperatures, while describing the wider effects of increased CO2 as climate change.
In 1986 and November 1987, NASA climate scientist James Hansen gave testimony to Congress on global warming. There were increasing heatwaves and drought problems in the summer of 1988, and when Hansen testified in the Senate on 23 June he sparked worldwide interest. He said, "global warming has reached a level such that we can ascribe with a high degree of confidence a cause and effect relationship between the greenhouse effect and the observed warming." Public attention increased over the summer, and global warming became the dominant popular term, commonly used both by the press and in public discourse.
In a 2008 NASA article on usage, Erik M. Conway defined global warming as "the increase in Earth’s average surface temperature due to rising levels of greenhouse gases", while climate change was "a long-term change in the Earth’s climate, or of a region on Earth." As effects such as changing patterns of rainfall and rising sea levels would probably have more impact than temperatures alone, he considered global climate change a more scientifically accurate term, and like the Intergovernmental Panel on Climate Change, the NASA website would emphasize this wider context.